В этой части изучения Tkinter мы немного порисуем. Рисование в Tkinter реализовано при помощи виджета Canvas. Это функционал высокого уровня, который позволяет создавать графику в Tkinter. Рисование можно использовать для создания графиков статистики, самодельных пользовательских виджетов и даже небольших игр.
Содержание курса
- Создание окна по центру и кнопка выхода в Tkinter
- Разметка виджетов в Tkinter — pack, grid и place
- Виджеты Checkbutton, Label, Scale и Listbox в Tkinter
- Меню, подменю и панель инструментов в Tkinter
- Диалоговые окна в Tkinter — Выбор цвета — Выбор файла
- Рисуем линии, прямоугольники, круг и текст в Tkinter
- Пишем игру змейка на Tkinter
Содержание статьи
- Рисуем линии в Tkinter — create_line()
- Создаем цветные прямоугольники в Tkinter
- Рисуем различные формы в Tkinter
- Вставляем изображение в Canvas
- Меняем шрифт и рисуем текст в Tkinter
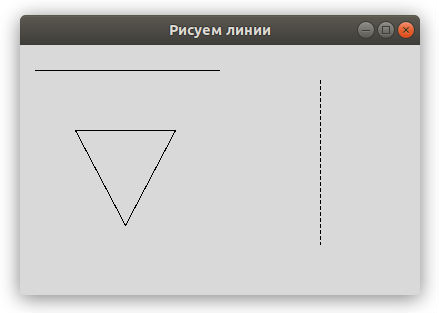
Рисуем линии в Tkinter — create_line()
Линия – это примитивный геометрический элемент. На виджете Canvas создать линию можно при помощи метода create_line().
|
1 2 3 4 5 6 7 8 9 10 11 12 13 14 15 16 17 18 19 20 21 22 23 24 25 26 27 28 29 30 |
from tkinter import Tk, Canvas, Frame, BOTH class Example(Frame): def __init__(self): super().__init__() self.initUI() def initUI(self): self.master.title(«Рисуем линии») self.pack(fill=BOTH, expand=1) canvas = Canvas(self) canvas.create_line(15, 25, 200, 25) canvas.create_line(300, 35, 300, 200, dash=(4, 2)) canvas.create_line(55, 85, 155, 85, 105, 180, 55, 85) canvas.pack(fill=BOTH, expand=1) def main(): root = Tk() ex = Example() root.geometry(«400×250+300+300») root.mainloop() if __name__ == ‘__main__’: main() |
В примере нашего кода, мы рисуем простые линии в Tkinter.
|
canvas.create_line(15, 25, 200, 25) |
Параметрами метода create_line() являются координаты x и y, которые обозначают стартовые и конечные точки линии.
|
canvas.create_line(300, 35, 300, 200, dash=(4, 2)) |
Мы нарисовали вертикальную линию. Опция dash позволяет создать пунктированную линию. Множества (4, 3) означает:
- 4 — длинна тире или точки в пикселях;
- 2 — пустой промежуток между тире либо точками.
Если указать dash=(1, 1) то у нас будет линия из точек.
|
canvas.create_line(55, 85, 155, 85, 105, 180, 55, 85) |
Метод create_line() может содержать несколько конечных точек, которые будут пресекаться линией. Согласно этому коду мы нарисовали треугольник имея три координата разных точек.
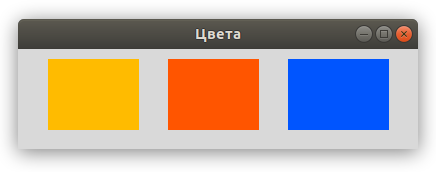
Цвет является объектом, который отображает комбинацию Красного, Зеленого и Синего цветов (RGB).
|
1 2 3 4 5 6 7 8 9 10 11 12 13 14 15 16 17 18 19 20 21 22 23 24 25 26 27 28 29 30 31 32 33 34 35 36 37 38 39 40 41 |
from tkinter import Tk, Canvas, Frame, BOTH class Example(Frame): def __init__(self): super().__init__() self.initUI() def initUI(self): self.master.title(«Цвета») self.pack(fill=BOTH, expand=1) canvas = Canvas(self) canvas.create_rectangle( 30, 10, 120, 80, outline=«#fb0», fill=«#fb0» ) canvas.create_rectangle( 150, 10, 240, 80, outline=«#f50», fill=«#f50» ) canvas.create_rectangle( 270, 10, 370, 80, outline=«#05f», fill=«#05f» ) canvas.pack(fill=BOTH, expand=1) def main(): root = Tk() ex = Example() root.geometry(«400×100+300+300») root.mainloop() if __name__ == ‘__main__’: main() |
В данном примере мы нарисовали прямоугольники и закрасили их разными цветами. Мы ранее работали с выбором цвета в Tkinter используя диалоговое окно цветовой палитры.
Мы создали виджет canvas.
|
canvas.create_rectangle( 30, 10, 120, 80, outline=«#fb0», fill=«#fb0» ) |
Есть вопросы по Python?
На нашем форуме вы можете задать любой вопрос и получить ответ от всего нашего сообщества!
Telegram Чат & Канал
Вступите в наш дружный чат по Python и начните общение с единомышленниками! Станьте частью большого сообщества!
Паблик VK
Одно из самых больших сообществ по Python в социальной сети ВК. Видео уроки и книги для вас!
С помощью create_rectangle() мы создаем прямоугольник на холсте. Первыми четырьмя параметрами являются x и y координаты двух ограничительных точек: верхней левой и нижней правой. При помощи параметра outline мы можем задать цвет контура прямоугольников. А параметр fill используется для окрашивания всей внутренней области прямоугольника.
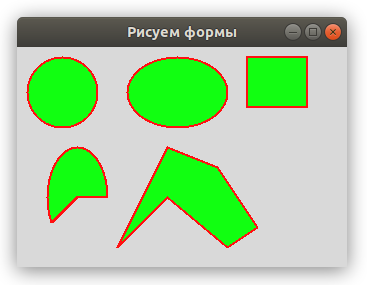
Рисуем различные формы в Tkinter
На холсте мы можем нарисовать самые разнообразные формы. На представленном ниже примере показаны некоторые из них.
|
1 2 3 4 5 6 7 8 9 10 11 12 13 14 15 16 17 18 19 20 21 22 23 24 25 26 27 28 29 30 31 32 33 34 35 36 37 38 39 40 41 42 43 44 45 46 47 48 49 50 51 52 53 54 55 56 57 58 59 |
from tkinter import Tk, Canvas, Frame, BOTH class Example(Frame): def __init__(self): super().__init__() self.initUI() def initUI(self): self.master.title(«Рисуем формы») self.pack(fill=BOTH, expand=1) canvas = Canvas(self) # Овальная форма. canvas.create_oval( 10, 10, 80, 80, outline=«#f11», fill=«#1f1», width=2 ) # Овальная форма. canvas.create_oval( 110, 10, 210, 80, outline=«#f11», fill=«#1f1», width=2 ) # Рисуем прямоугольник. canvas.create_rectangle( 230, 10, 290, 60, outline=«#f11», fill=«#1f1», width=2 ) # Рисуем дугу. canvas.create_arc( 30, 200, 90, 100, start=0, extent=210, outline=«#f11», fill=«#1f1», width=2 ) points = [ 150, 100, 200, 120, 240, 180, 210, 200, 150, 150, 100, 200 ] # Рисуем многоугольник. canvas.create_polygon(points, outline=‘#f11’, fill=‘#1f1’, width=2) canvas.pack(fill=BOTH, expand=1) def main(): root = Tk() ex = Example() root.geometry(«330×220+300+300») root.mainloop() if __name__ == ‘__main__’: main() |
Мы нарисовали разные формы в окне:
- круг;
- овал;
- прямоугольник;
- дугу и многугольник.
Контур окрашен в красный цвет, фигуры были наполнены зеленым цветом. Ширина контура указана в 2 пикселя.
|
canvas.create_oval( 10, 10, 80, 80, outline=«red», fill=«green», width=2 ) |
Метод create_oval() используется для того, чтобы создать круг в Tkinter. Первые четыре параметра определяют ограничивающие координаты фигуры. Иными словами, это x и y координаты верхней левой и правой нижней точек квадрата, в который помещен круг.
|
canvas.create_rectangle( 230, 10, 290, 60, outline=«#f11», fill=«#1f1», width=2 ) |
Мы нарисовали прямоугольник в Tkinter. Координаты снова обозначают ограничительные точки с координатами x и y..
|
canvas.create_arc( 30, 200, 90, 100, start=0, extent=210, outline=«#f11», fill=«#1f1», width=2 ) |
С помощью этого кода мы создаем дугу. Дуга является частью круга. Мы указывает ограничительные координаты нашей дуги.
Успейте заказать просмотры на видео в YouTube ДокторСмм по наиболее дешевой цене с большими оптовыми скидками. Кроме того, с заказом Вы сможете получить также персональные условия на приобретение ресурса с возможностью выбора более подходящей для Вашей ситуации скорости поступления просмотров. Торопитесь, скидки действуют ограниченное время!
С помощью параметра start мы устанавливаем угол дуги. Параметр extent указывает на размер угла.
|
points = [ 150, 100, 200, 120, 240, 180, 210, 200, 150, 150, 100, 200 ] canvas.create_polygon( points, outline=‘red’, fill=‘green’, width=2 ) |
Данный код позволяет нам создать многоугольник. У этой фигуры присутствует большое количество углов. Чтобы создать многоугольник в Tkinter, нам нужно задать несколько координат, используя метод create_polygon().
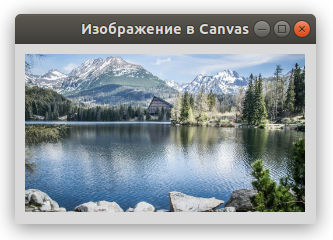
Вставляем изображение в Canvas
В данном примере мы рассмотрим, как вставить изображение в canvas виджете.
В данном примере используется файл изображения tatras.jpg который нужно сохранить рядом с нами кодом:
- tatras.jpg
|
1 2 3 4 5 6 7 8 9 10 11 12 13 14 15 16 17 18 19 20 21 22 23 24 25 26 27 28 29 30 31 32 33 34 |
from tkinter import Tk, Canvas, Frame, BOTH, NW from PIL import Image, ImageTk class Example(Frame): def __init__(self): super().__init__() self.initUI() def initUI(self): self.master.title(«Изображение в Canvas») self.pack(fill=BOTH, expand=1) self.img = Image.open(«tatras.jpg») self.tatras = ImageTk.PhotoImage(self.img) canvas = Canvas( self, width=self.img.size[0]+20, height=self.img.size[1]+20 ) canvas.create_image(10, 10, anchor=NW, image=self.tatras) canvas.pack(fill=BOTH, expand=1) def main(): root = Tk() ex = Example() root.mainloop() if __name__ == ‘__main__’: main() |
В примере продемонстрировано как добавить изображение в Canvas.
|
self.img = Image.open(«tatras.jpg») self.tatras = ImageTk.PhotoImage(self.img) |
Из библиотеки Pillow мы используем модули Image и ImageTk.
|
canvas = Canvas( self, width=self.img.size[0]+20, height=self.img.size[1]+20 ) |
Мы создаем виджет Canvas. Учитываем размеры изображения. Холст будет на 20 пикселей шире и на 20 пикселей выше, нежели наше изображение.
|
canvas.create_image(10, 10, anchor=NW, image=self.tatras) |
Мы используем метод create_image(), чтобы создать изображение на холсте. Чтобы показать изображение, оно закрепляется в северном и западном направлениях anchor=NW нашего окна. Параметр image позволяет отобразить изображение.
Меняем шрифт и рисуем текст в Tkinter
В последнем примере мы рассмотрим рисование текста используя виджет Canvas в Tkinter.
|
1 2 3 4 5 6 7 8 9 10 11 12 13 14 15 16 17 18 19 20 21 22 23 24 25 26 27 28 29 30 31 32 33 34 35 36 37 38 39 40 41 42 43 44 45 46 47 48 49 50 51 52 53 54 55 56 |
from tkinter import Tk, Canvas, Frame, BOTH, W class Example(Frame): def __init__(self): super().__init__() self.initUI() def initUI(self): self.master.title(«Текст и Шрифт в Tkinter») self.pack(fill=BOTH, expand=1) canvas = Canvas(self) canvas.create_text( 20, 30, anchor=W, font=«DejavuSansLight», text=«Красное солнце сгорает дотла» ) canvas.create_text( 20, 60, anchor=W, font=«Arial», text=«На пылающий город падает тень» ) canvas.create_text( 20, 130, anchor=W, font=«TimesNewRoman», text=«Перемен!» ) canvas.create_text( 20, 160, anchor=W, font=«ComicSans», text=«Требуют наши сердца» ) canvas.create_text( 20, 190, anchor=W, font=«FreeSerif», text=«Перемен!» ) canvas.create_text( 20, 220, anchor=W, font=«LatoThin», text=«Требуют наши глаза» ) canvas.pack(fill=BOTH, expand=1) def main(): root = Tk() ex = Example() root.geometry(«420×250+300+300») root.mainloop() if __name__ == ‘__main__’: main() |
Мы рисуем слова из песни в нашем окне.
|
canvas.create_text( 20, 30, anchor=W, font=«DejavuSansLight», text=«Красное солнце сгорает дотла» ) |
Первые два параметра – это x и y координаты центральной точки текста. Если мы закрепим текстовый объект по направлению запада anchor=W, текст будет начинаться в этой части окна. Параметр font позволяет нам менять шрифт текста, а параметр text отображает написанный текст в окне.
![Рисуем линии, прямоугольники, круг и текст в Tkinter [Урок №6]](https://python-scripts.com/wp-content/uploads/2016/09/draw-text-tkinter.jpg)

Являюсь администратором нескольких порталов по обучению языков программирования Python, Golang и Kotlin. В составе небольшой команды единомышленников, мы занимаемся популяризацией языков программирования на русскоязычную аудиторию. Большая часть статей была адаптирована нами на русский язык и распространяется бесплатно.
E-mail: vasile.buldumac@ati.utm.md
Образование
Universitatea Tehnică a Moldovei (utm.md)
- 2014 — 2018 Технический Университет Молдовы, ИТ-Инженер. Тема дипломной работы «Автоматизация покупки и продажи криптовалюты используя технический анализ»
- 2018 — 2020 Технический Университет Молдовы, Магистр, Магистерская диссертация «Идентификация человека в киберпространстве по фотографии лица»
Виджет Canvas() — Холст используется для добавления структурированной графики в приложение.
Синтаксис создания виджета подобен, другим объектам tkinter:
widget_name = Canvas(parent, options)
1
parent— окно или фрейм (рамка), в котором будет размещаться холст;options— параметры настройки холста.
Базовые параметры
bd— представляет ширину границы. Ширина по умолчанию — 2.bg— он представляет собой цвет фона холста.confine— он настроен на то, чтобы холст нельзя было прокручивать за пределами области прокрутки.cursor— курсор используется как стрелка, круг, точка и т.д. На холсте.height— представляет размер холста в вертикальном направлении.highlightcolor— представляет цвет выделения, когда виджет находится в фокусе.relief— представляет собой тип бордюра. Возможные значения: SUNKEN, RAISED, GROOVE и RIDGE.scrollregion— представляет координаты, заданные как кортеж, содержащий область холста.widthОн представляет собой ширину холста.xscrollincrement— если задано положительное значение. Холст размещается только с кратным этому значению.xscrollcommand— если холст можно прокручивать, этот атрибут должен быть методом .set() горизонтальной полосы прокрутки.yscrollincrement— работает какxscrollincrement, но управляет вертикальным перемещением.yscrollcommand— если холст можно прокручивать, этот атрибут должен быть методом .set() вертикальной полосы прокрутки.
В tkinter от класса Canvas() создаются объекты-холсты, на которых можно «рисовать», размещая различные фигуры и объекты. Делается это с помощью вызовов соответствующих методов.
При создании экземпляра Canvas необходимо указать его ширину и высоту. При размещении геометрических примитивов и других объектов указываются их координаты на холсте. Точкой отсчета является верхний левый угол.
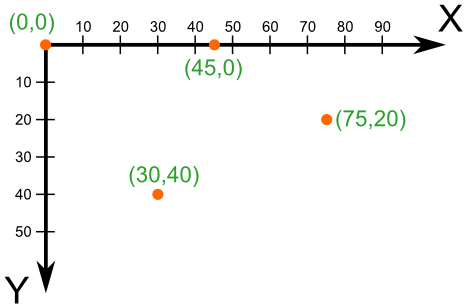
В программе ниже создается холст. На нем с помощью метода create_line() рисуются отрезки. Сначала указываются координаты начала (x1, y1), затем – конца (x2, y2):
from tkinter import *

root = Tk()

c = Canvas(root, width=200, height=200, bg='white')
c.pack()

c.create_line(10, 10, 190, 50)
c.create_line(100, 180, 100, 60,
     fill='green', width=5, arrow=LAST,
     dash=(10,2), activefill='lightgreen',
     arrowshape="10 20 10")

root.mainloop()
1
2
3
4
5
6
7
8
9
10
11
12
13
14
Остальные свойства являются необязательными. Так activefill определяет цвет отрезка при наведении на него курсора мыши.
Создание прямоугольников методом create_rectangle():
…
c.create_rectangle(10, 10, 190, 60)
c.create_rectangle(60, 80, 140, 190, fill='yellow', outline='green', width=3, activedash=(5, 4))
…
1
2
3
4
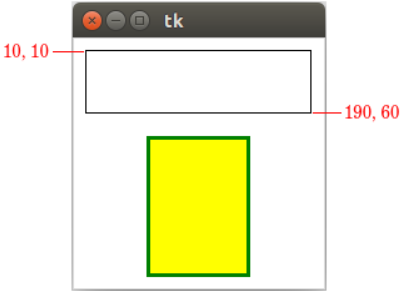
Первые координаты – верхний левый угол, вторые – правый нижний. В приведенном примере, когда на второй прямоугольник попадает курсор мыши, его рамка становится пунктирной, что определяется свойством activedash.
Методом create_polygon() рисуется произвольный многоугольник путем задания координат каждой его точки:
…
c.create_polygon(100, 10, 20, 90, 180, 90)
c.create_polygon(40, 110, 160, 110, 190, 180, 10, 180, fill='orange', outline='black')
…
1
2
3
4
Для удобства координаты точек можно заключать в скобки:
…
c.create_polygon((40, 110), (160, 110), (190, 180), (10, 180), fill='orange', outline='black')
…
1
2
3
Метод create_oval() создает эллипсы. При этом задаются координаты гипотетического прямоугольника, описывающего эллипс. Если нужно получить круг, то соответственно описываемый прямоугольник должен быть квадратом:
…
c.create_oval(50, 10, 150, 110, width=2)
c.create_oval(10, 120, 190, 190, fill='grey70', outline='white')
…
1
2
3
4
Более сложные для понимания фигуры получаются при использовании метода create_arc(). В зависимости от значения опции style можно получить сектор (по умолчанию), сегмент (CHORD) или дугу (ARC). Также как в случае create_oval() координаты задают прямоугольник, в который вписана окружность (или эллипс), из которой «вырезают» сектор, сегмент или дугу. Опции start присваивается градус начала фигуры, extent определяет угол поворота:
…
c.create_oval(10, 10, 190, 190, fill='lightgrey', outline='white')
c.create_arc(10, 10, 190, 190, start=0, extent=45, fill='red')
c.create_arc(10, 10, 190, 190, start=180, extent=25, fill='orange')
c.create_arc(10, 10, 190, 190, start=240, extent=100, style=CHORD, fill='green')
c.create_arc(10, 10, 190, 190, start=160, extent=-70, style=ARC, outline='darkblue', width=5)
…
1
2
3
4
5
6
7
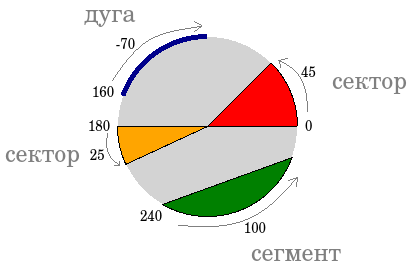
В данном примере светло-серый круг используется исключительно для наглядности.
На холсте можно разместить текст. Делается это с помощью метода create_text():
…
c.create_text(100, 100, text="Hello World,nPythonnand Tk", justify=CENTER, font="Verdana 14")
c.create_text(200, 200, text="About this", anchor=SE, fill="grey")
…
1
2
3
4
По умолчанию в заданной координате располагается центр текстовой надписи. Чтобы изменить это и, например, разместить по указанной координате левую границу текста, используется якорь со значением W (от англ. west – запад). Другие значения: N, NE, E, SE, S, SW, W, NW. Если букв, задающих сторону привязки, две, то вторая определяет вертикальную привязку (вверх или вниз «уйдет» текст от заданной координаты). Свойство justify определяет лишь выравнивание текста относительно себя самого.
Упражнения
- Создайте на холсте подобное изображение:
- Для создания травы используется цикл.
Canvas. Идентификаторы, теги и анимация
Изучив размещение геометрических примитивов на экземпляре Canvas, в этом уроке рассмотрим, как можно обращаться к уже созданным фигурам для изменения их свойств, а также создадим анимацию.
В tkinter существует два способа «пометить» фигуры, размещенные на холсте, – это идентификаторы и теги. Первые всегда уникальны для каждого объекта. Два объекта не могут иметь одни и тот же идентификатор. Теги не уникальны. Группа объектов на холсте может иметь один и тот же тег. Это дает возможность менять свойства всей группы. Отдельно взятая фигура на Canvas может иметь как идентификатор, так и тег.
Методы, создающие фигуры на холсте, возвращают численные идентификаторы этих объектов, которые можно присвоить переменным, через которые позднее обращаться к созданным фигурам:
from tkinter import *
root = Tk()
c = Canvas(width=300, height=300, bg='white')
c.focus_set()
c.pack()

ball = c.create_oval(140, 140, 160, 160, fill='green')
c.bind('<Up>', lambda event: c.move(ball, 0, -2))
c.bind('<Down>', lambda event: c.move(ball, 0, 2))
c.bind('<Left>', lambda event: c.move(ball, -2, 0))
c.bind('<Right>', lambda event: c.move(ball, 2, 0))

root.mainloop()
1
2
3
4
5
6
7
8
9
10
11
12
13
В данном примере круг двигается по холсту с помощью стрелок на клавиатуре. Когда создавался круг, его идентификатор был присвоен переменной ball. Метод move() объекта Canvas принимает идентификатор и смещение по осям.
С помощью метода itemconfig() можно изменять другие свойства. Метод coords() устанавливает новые координаты фигуры, если они заданы. Если указывается только идентификатор или тег, то coords() возвращает текущие координаты:
from tkinter import *
root = Tk()
c = Canvas(width=200, height=200, bg='white')
c.pack()

rect = c.create_rectangle(80, 80, 120, 120, fill='lightgreen')

def inFocus(event):
    c.itemconfig(rect, fill='green', width=2)
    c.coords(rect, 70, 70, 130, 130)
c.bind('<FocusIn>', inFocus)

root.mainloop()
1
2
3
4
5
6
7
8
9
10
11
12
13
Здесь при получении холстом фокуса (нажать Tab) изменится цвет и размер квадрата.
В отличие от идентификаторов, которые являются уникальными для каждого объекта, один и тот же тег может присваиваться разным объектам. Дальнейшее обращение к такому тегу позволит изменить все объекты, в которых он был указан. В примере ниже эллипс и линия содержат один и тот же тег, а функция color изменяет цвет всех объектов с тегом group1. Обратите внимание, что в отличие от имени идентификатора (переменная), имя тега заключается в кавычки (строковое значение):
…
oval = c.create_oval(30, 10, 130, 80, tag="group1")
c.create_line(10, 100, 450, 100, tag="group1")

def color(event):
     c.itemconfig('group1',fill="red",width=3)

c.bind('<Button-3>', color)
…
1
2
3
4
5
6
7
8
9
Метод tag_bind() позволяет привязать событие (например, щелчок кнопкой мыши) к определенной фигуре на Canvas. Таким образом, можно реализовать обращение к различным областям холста с помощью одного и того же события. Пример ниже иллюстрирует, как изменения на холсте зависят от того, где произведен клик:
from tkinter import *

c = Canvas(width=460, height=100, bg='grey80')
c.pack()

oval = c.create_oval(30, 10, 130, 80, fill="orange")
c.create_rectangle(180, 10, 280, 80, tag="rect", fill="lightgreen")
trian = c.create_polygon(330, 80, 380, 10, 430, 80, fill='white',outline="black")

def oval_func(event):
     c.delete(oval)
     c.create_text(80, 50, text="Круг")

def rect_func(event):
     c.delete("rect")
     c.create_text(230, 50, text="Прямоугольник")

def triangle(event):
     c.delete(trian)
     c.create_text(380, 50, text="Треугольник")

c.tag_bind(oval, '<Button-1>', oval_func)
c.tag_bind("rect", '<Button-1>', rect_func)
c.tag_bind(trian, '<Button-1>', triangle)

mainloop()
1
2
3
4
5
6
7
8
9
10
11
12
13
14
15
16
17
18
19
20
21
22
23
24
25
26
До кликов:
После кликов:
Метод delete() удаляет объект. Если нужно очистить холст, то вместо идентификаторов или тегов используется константа ALL.
Упражнения
Практическая работа. Анимация в tkinter.
В данной программе создается анимация круга, который движется от левой границы холста до правой:
from tkinter import *

root = Tk()
c = Canvas(root, width=300, height=200, bg="white")
c.pack()

ball = c.create_oval(0, 100, 40, 140, fill='green')

def motion():
    c.move(ball, 1, 0)
    if c.coords(ball)[2] < 300:
        root.after(20, motion)

motion()

root.mainloop()
1
2
3
4
5
6
7
8
9
10
11
12
13
14
15
16
Выражение c.coords(ball) возвращает список текущих координат объекта (в данном случае это ball). Третий элемент списка соответствует его второй координате x.
Метод after() вызывает функцию, переданную вторым аргументом, через количество миллисекунд, указанных первым аргументом.
Изучите приведенную программу и самостоятельно запрограммируйте постепенное движение фигуры в ту точку холста, где пользователь кликает левой кнопкой мыши. Координаты события хранятся в его атрибутах x и y (event.x, event.y).
The Canvas widget provides structured graphics facilities
for Tkinter. This is a highly versatile widget which can be used to
draw graphs and plots, create graphics editors, and implement
various kinds of custom widgets.
When to use the Canvas Widget #
The canvas is a general purpose widget, which is typically used
to display and edit graphs and other drawings.
Another common use for this widget is to implement various kinds
of custom widgets. For example, you can use a canvas as a
completion bar, by drawing and updating a rectangle on the
canvas.
Patterns #
To draw things in the canvas, use the create methods to add
new items.
from Tkinter import *

master = Tk()

w = Canvas(master, width=200, height=100)
w.pack()

w.create_line(0, 0, 200, 100)
w.create_line(0, 100, 200, 0, fill="red", dash=(4, 4))

w.create_rectangle(50, 25, 150, 75, fill="blue")

mainloop()
Note that items added to the canvas are kept until you remove them.
If you want to change the drawing, you can either use methods like
coords, itemconfig, and move to modify the items,
or use delete to remove them.
i = w.create_line(xy, fill="red")

w.coords(i, new_xy)
w.itemconfig(i, fill="blue")

w.delete(i)

w.delete(ALL)
Concepts #
To display things on the canvas, you create one or more
canvas items, which are placed in a stack. By default, new
items are drawn on top of items already on the canvas.
Tkinter provides lots of methods allowing you to manipulate the
items in various ways. Among other things, you can attach
(bind) event callbacks to individual canvas items.
Canvas Items #
The Canvas widget supports the following standard
items:
- arc (arc, chord,
or pieslice) - bitmap
(built-in or read from XBM file) - image (a
BitmapImage or PhotoImage instance) - line
- oval (a circle
or an ellipse) - polygon
- rectangle
- text
- window
Chords, pieslices, ovals, polygons, and rectangles consist of
both an outline and an interior area, either of which can be made
transparent (and if you insist, you can make both transparent).
Window items are used to place other Tkinter widgets on top of
the canvas; for these items, the Canvas widget simply acts like a
geometry manager.
You can also write your own item types in C or C++ and plug them
into Tkinter via Python extension modules.
Coordinate Systems #
The Canvas widget uses two coordinate systems; the window
coordinate system (with (0, 0) in the upper left corner), and a
canvas coordinate system which specify where the items are drawn.
By scrolling the canvas, you can specify which part of the canvas
coordinate system to show in the window.
The scrollregion option is used to limit scrolling
operations for the canvas. To set this, you can usually use
something like:
canvas.config(scrollregion=canvas.bbox(ALL))
To convert from window coordinates to canvas coordinates, use
the canvasx and
canvasy methods:
def callback(event):
    canvas = event.widget
    x = canvas.canvasx(event.x)
    y = canvas.canvasy(event.y)
    print canvas.find_closest(x, y)
Item Specifiers: Handles and Tags #
The Canvas widget allows you to identify items in several
ways. Everywhere a method expects an item specifier, you can use
one of the following:
- item handles (integers)
- tags
- ALL
- CURRENT
Item handles are integer values used to identify a
specific item on the canvas. Tkinter automatically assigns a new
handle to each new item created on the canvas. Item handles can be
passed to the various canvas methods either as integers or as
strings.
Tags are symbolic names attached to items. Tags are
ordinary strings, and they can contain anything except whitespace
(as long as they don’t look like item handles).
An item can have zero or more tags associated with it, and the
same tag can be used for more than one item. However, unlike the
Text widget, the Canvas widget doesn’t allow you to
create bindings or otherwise configure tags for which there are no
existing items. Tags are owned by the items, not the widget itself.
All such operations are ignored.
You can either specify the tags via an option when you create
the item, set them via the
itemconfig
method, or add them using the
addtag_withtag
method. The tags option takes either a single tag string, or
a tuple of strings.
item = canvas.create_line(0, 0, 100, 100, tags="uno")
canvas.itemconfig(item, tags=("one", "two"))
canvas.addtag_withtag("three", "one")
To get all tags associated with a specific item, use
gettags. To get the handles for all items having a given
tag, use find_withtag.
>>> print canvas.gettags(item)
('one', 'two', 'three')
>>> print canvas.find_withtag("one")
(1,)
The Canvas widget also provides two predefined tags:
ALL (or the string “all”) matches all items on the
canvas.
CURRENT (or “current”) matches the item under the mouse
pointer, if any. This can be used inside mouse event bindings to
refer to the item that triggered the callback.
Printing #
The Tkinter widget supports printing to Postscript printers.
Performance Issues #
The Canvas widget implements a straight-forward
damage/repair display model. Changes to the canvas, and external
events such as Expose, are all treated as “damage” to the
screen. The widget maintains a dirty rectangle to keep track
of the damaged area.
When the first damage event arrives, the canvas registers an
idle task (using after_idle) which is used to “repair” the
canvas when the program gets back to the Tkinter main loop. You can
force updates by calling the update_idletasks method.
When it’s time to redraw the canvas, the widget starts by
allocating a pixmap (on X windows, this is an image memory stored
on the display) with the same size as the dirty rectangle.
It then loops over the canvas items, and redraws all
items for which the bounding box touch the dirty rectangle (this
means that diagonal lines may be redrawn also if they don’t
actually cover the rectangle, but this is usually no big deal).
Finally, the widget copies the pixmap to the display, and
releases the pixmap. The copy operation is a very fast operation on
most modern hardware.
Since the canvas uses a single dirty rectangle, you can
sometimes get better performance by forcing updates. For example,
if you’re changing things in different parts of the canvas without
returning to the main loop, adding explicit calls to
update_idletasks() allows the canvas to update a few small
rectangles, instead of a large one with many more objects.
Reference #
- Canvas(master=None, **options) (class) [#]
-
A structured graphics canvas.
- master
- Parent widget.
- **options
-
Widget options. See the description of
the config method for a list of available
options.
- addtag(tag, method, *args) [#]
-
Adds a tag to a number of items. Application code should use
more specific methods wherever possible (that is, use
addtag_above instead of addtag(“above”),
and so on.- tag
- The tag to add.
- method
-
How to add a new tag. This can be one of “above”,
“all”, “below”, “closest”, “enclosed”, “overlapping” or
“withtag”. - *args
-
Additional arguments. For details, see the description
of the individual method.
- addtag_above(tag, item) [#]
-
Adds a tag to the item just above the given item.
- tag
- The tag to add.
- item
- The tag or id of the reference item.
- addtag_all(tag) [#]
-
Adds a tag to all items on the canvas. This is a shortcut for
addtag_withtag(newtag, ALL).- tag
- The tag to add.
- addtag_below(tag, item) [#]
-
Adds a tag to the item just below the given item.
- tag
- The tag to add.
- item
- The tag or id of the reference item.
- addtag_closest(tag, x, y, halo=None, start=None) [#]
-
Adds a tag to the item closest to the given coordinate. Note
that the position is given in canvas coordinates, and that
this method always succeeds if there’s at least one item in
the canvas. To add tags to items within a certain distance
from the position, useadd_overlapping(dead link) with a
small rectangle centered on the position.- tag
- The tag to add.
- x
- The horizontal coordinate.
- y
- The vertical coordinate.
- halo
- Optional halo distance.
- start
- Optional start item.
- addtag_enclosed(tag, x1, y1, x2, y2) [#]
-
Adds a tag to all items enclosed by the given rectangle.
- tag
- The tag to add.
- x1
- Left coordinate.
- y1
- Top coordinate.
- x2
- Right coordinate.
- y2
- Bottom coordinate.
- addtag_overlapped(tag, x1, y1, x2, y2) [#]
-
Adds a tag to all items overlapping the given rectangle. This
includes items that are completely enclosed by it.- tag
- The tag to add.
- x1
- Left coordinate.
- y1
- Top coordinate.
- x2
- Right coordinate.
- y2
- Bottom coordinate.
- addtag_withtag(tag, item) [#]
-
Adds a tag to all items having the given tag.
- tag
- The tag to add.
- item
-
The reference item. If a tag is given, the new tag
is added to all items that have this tag. You can also give
an id, to add a tag to a single item.
- bbox(item=None) [#]
-
Returns the bounding box for all matching items. If the tag
is omitted, the bounding box for all items is returned. Note
that the bounding box is approximate and may differ a few
pixels from the real value.- item
-
Item specifier. If omitted, the bounding box
for all elements on the canvas. - Returns:
- The bounding box, as a 4-tuple.
- canvasx(x, gridspacing=None) [#]
-
Converts a window coordinate to a canvas coordinate.
- x
- Screen coordinate.
- gridspacing
-
Optional grid spacing. The coordinate
is rounded to the nearest grid coordinate. - Returns:
- Canvas coordinate.
- canvasy(y, gridspacing=None) [#]
-
Converts a window coordinate to a canvas coordinate.
- y
- Screen coordinate.
- gridspacing
-
Optional grid spacing. The coordinate
is rounded to the nearest grid coordinate. - Returns:
- Canvas coordinate.
- config(**options) [#]
-
Modifies one or more widget options. If no options are given,
the method returns a dictionary containing all current option
values.- **options
- Widget options.
- background=
-
Canvas background color. Defaults to the
standard widget background color.
(the database name is background, the class is Background) - bg=
- Same as background.
- borderwidth=
-
Width of the canvas border. The default
is 0 (no border).
(borderWidth/BorderWidth) - bd=
- Same as borderwidth.
- closeenough=
-
The default value is 1.
(closeEnough/CloseEnough) - confine=
-
The default value is 1.
(confine/Confine) - cursor=
-
The cursor to use when the mouse is moved
over the canvas.
(cursor/Cursor) - height=
-
Canvas width. Default value is ‘7c’.
(height/Height) - highlightbackground=
-
The color to use for the highlight
border when the canvas does not have focus. The default is
system specific.
(highlightBackground/HighlightBackground) - highlightcolor=
-
The color to use for the highlight border
when the canvas has focus. The default is system speciific.
(highlightColor/HighlightColor) - highlightthickness=
-
The width of the highlight border.
The default is system specific (usually one or two pixels).
(highlightThickness/HighlightThickness) - insertbackground=
-
The color to use for the text insertion
cursor. The default is system specific.
(insertBackground/Foreground) - insertborderwidth=
-
Width of the insertion cursor’s border.
If this is set to a non-zero value, the cursor is drawn using
the RAISED border style.
(insertBorderWidth/BorderWidth) - insertofftime=
-
Together with insertontime, this
option controls cursor blinking. Both values are given in
milliseconds.
(insertOffTime/OffTime) - insertontime=
-
See insertofftime.
(insertOnTime/OnTime) - insertwidth=
-
Width of the insertion cursor. Usually
one or two pixels.
(insertWidth/InsertWidth) - offset=
-
Default value is ‘0,0’.
(offset/Offset) - relief=
-
Border style. The default is FLAT.
Other possible values are SUNKEN, RAISED,
GROOVE, and RIDGE.
(relief/Relief) - scrollregion=
-
Canvas scroll region. No default value.
(scrollRegion/ScrollRegion) - selectbackground=
-
Selection background color. The default
is system and display specific.
(selectBackground/Foreground) - selectborderwidth=
-
Selection border width. The default is
system specific.
(selectBorderWidth/BorderWidth) - selectforeground=
-
Selection text color. The default is
system specific.
(selectForeground/Background) - state=
-
Canvas state. One of NORMAL, DISABLED, or HIDDEN.
The default is NORMAL. Note that this is a global setting, but
individual canvas items can use the item-level state
option to override this setting.
(state/State) - takefocus=
-
Indicates that the user can use the Tab
key to move to this widget. Default is an empty string, which
means that the canvas widget accepts focus only if it has any
keyboard bindings.
(takeFocus/TakeFocus) - width=
-
Canvas width. Default value is ‘10c’.
(width/Width) - xscrollcommand=
-
Used to connect a canvas to a
horizontal scrollbar. This option should be set to the
set method of the corresponding scrollbar.
(xScrollCommand/ScrollCommand) - xscrollincrement=
-
Default value is 0.
(xScrollIncrement/ScrollIncrement) - yscrollcommand=
-
Used to connect a canvas to a
vertical scrollbar. This option should be set to the
set method of the corresponding scrollbar.
(yScrollCommand/ScrollCommand) - yscrollincrement=
-
Default value is 0.
(yScrollIncrement/ScrollIncrement)
- coords(item, *coords) [#]
-
Returns the coordinates for an item.
- item
- Item specifier (tag or id).
- *coords
-
Optional list of coordinate pairs. If given,
the coordinates will replace the current coordinates for
all matching items. - Returns:
-
If no coordinates are given, this method returns the
coordinates for the matching item. If the item specifier
matches more than one item, the coordinates for the first
item found is returned.
- create_arc(bbox, **options) [#]
-
Draws an arc, pieslice, or chord on the canvas. The new item
is drawn on top of the existing items.- bbox
- Bounding box for the full arc.
- **options
- Arc options.
- activedash=
- activefill=
-
Fill color to use when the mouse pointer is
moved over the item, if different from fill. - activeoutline=
- activeoutlinestipple=
- activestipple=
- activewidth=
- Default is 0.0.
- dash=
-
Outline dash pattern, given as a list of segment
lengths. Only the odd segments are drawn. - dashoffset=
- Default is 0.
- disableddash=
- disabledfill=
-
Fill color to use when the item is disabled,
if different from fill. - disabledoutline=
- disabledoutlinestipple=
- disabledstipple=
- disabledwidth=
- Default is 0.0.
- extent=
-
The size, relative to the start angle.
Default is 90.0. - fill=
- Fill color. An empty string means transparent.
- offset=
- Default is “0,0”.
- outline=
- Outline color. Default is “black”.
- outlineoffset=
- Default is “0,0”.
- outlinestipple=
- Outline stipple pattern.
- start=
- Start angle. Default is 0.0.
- state=
- Item state. One of NORMAL, DISABLED, or HIDDEN.
- stipple=
- Stipple pattern.
- style=
-
One of PIESLICE, CHORD, or ARC. Default is
PIESLICE. - tags=
-
A tag to attach to this item, or a tuple
containing multiple tags. - width=
- Default is 1.0.
- Returns:
- The item id.
- create_bitmap(position, **options) [#]
-
Draws a bitmap on the canvas.
- position
- Bitmap position, given as two coordinates.
- **options
- Bitmap options.
- activebackground=
- activebitmap=
- activeforeground=
- anchor=
-
Where to place the bitmap relative to the given
position. Default is CENTER. - background=
-
Background color, used for pixels that are
“off”. Use an empty string to make the background transparent.
Default is transparent. - bitmap=
-
The bitmap descriptor. See
BitmapImage for more
information. (To display a BitmapImage object, use
the create_image function.) - disabledbackground=
- disabledbitmap=
- disabledforeground=
- foreground=
-
Foreground colors, used for pixels that are
“on”. Default is “black”. - state=
- Item state. One of NORMAL, DISABLED, or HIDDEN.
- tags=
-
A tag to attach to this item, or a tuple
containing multiple tags. - Returns:
- The item id.
- create_image(position, **options) [#]
-
Draws an image on the canvas.
- position
- Image position, given as two coordinates.
- **options
- Image options.
- activeimage=
- anchor=
-
Where to place the image relative to the given
position. Default is CENTER. - disabledimage=
- image=
-
The image object. This should be a
PhotoImage or
BitmapImage,
or a compatible object (such as the PIL PhotoImage).
The application must keep a reference to the image
object. - state=
- Item state. One of NORMAL, DISABLED, or HIDDEN.
- tags=
-
A tag to attach to this item, or a tuple
containing multiple tags. - Returns:
- The item id.
- create_line(coords, **options) [#]
-
Draws a line on the canvas.
- coords
- Image coordinates.
- **options
- Line options.
- activedash=
- activefill=
-
Line color to use when the mouse pointer is
moved over the item, if different from fill. - activestipple=
- activewidth=
- Default is 0.0.
- arrow=
- Default is NONE.
- arrowshape=
- Default is “8 10 3”.
- capstyle=
- Default is BUTT.
- dash=
-
Dash pattern, given as a list of segment lengths.
Only the odd segments are drawn. - dashoffset=
- Default is 0.
- disableddash=
- disabledfill=
-
Line color to use when the item is disabled,
if different from fill. - disabledstipple=
- disabledwidth=
- Default is 0.0.
- fill=
- Line color. Default is “black”.
- joinstyle=
- Default is ROUND.
- offset=
- Default is “0,0”.
- smooth=
- Default is 0.
- splinesteps=
- Default is 12.
- state=
- Item state. One of NORMAL, DISABLED, or HIDDEN.
- stipple=
- Stipple pattern.
- tags=
-
A tag to attach to this item, or a tuple
containing multiple tags. - width=
- Default is 1.0.
- Returns:
- The item id.
- create_oval(bbox, **options) [#]
-
Draws an ellipse on the canvas.
- bbox
- Ellipse coordinates.
- **options
- Ellipse options.
- activedash=
- activefill=
-
Fill color to use when the mouse pointer is
moved over the item, if different from fill. - activeoutline=
- activeoutlinestipple=
- activestipple=
- activewidth=
- Default is 0.0.
- dash=
-
Outline dash pattern, given as a list of segment
lengths. Only the odd segments are drawn. - dashoffset=
- Default is 0.
- disableddash=
- disabledfill=
-
Fill color to use when the item is disabled,
if different from fill. - disabledoutline=
- disabledoutlinestipple=
- disabledstipple=
- disabledwidth=
- Default is 0.
- fill=
- Fill color. An empty string means transparent.
- offset=
- Default is “0,0”.
- outline=
- Outline color. Default is “black”.
- outlineoffset=
- Default is “0,0”.
- outlinestipple=
- Outline stipple pattern.
- state=
- Item state. One of NORMAL, DISABLED, or HIDDEN.
- stipple=
- Stipple pattern.
- tags=
-
A tag to attach to this item, or a tuple
containing multiple tags. - width=
- Default is 1.0.
- Returns:
- The item id.
- create_polygon(coords, **options) [#]
-
Draws a polygon on the canvas.
- coords
- Polygon coordinates.
- **options
- Polygon options.
- activedash=
- activefill=
-
Fill color to use when the mouse pointer is
moved over the item, if different from fill. - activeoutline=
- activeoutlinestipple=
- activestipple=
- activewidth=
- Default is 0.0.
- dash=
-
Outline dash pattern, given as a list of segment
lengths. Only the odd segments are drawn. - dashoffset=
- Default is 0.
- disableddash=
- disabledfill=
-
Fill color to use when the item is disabled,
if different from fill. - disabledoutline=
- disabledoutlinestipple=
- disabledstipple=
- disabledwidth=
- Default is 0.0.
- fill=
- Fill color. Default is “black”.
- joinstyle=
- Default is ROUND.
- offset=
- Default is “0,0”.
- outline=
- Outline color.
- outlineoffset=
- Default is “0,0”.
- outlinestipple=
- Outline stipple pattern.
- smooth=
- Default is 0.
- splinesteps=
- Default is 12.
- state=
- Item state. One of NORMAL, DISABLED, or HIDDEN.
- stipple=
- Stipple pattern.
- tags=
-
A tag to attach to this item, or a tuple
containing multiple tags. - width=
- Default is 1.0.
- Returns:
- The item id.
- create_rectangle(bbox, **options) [#]
-
Draws a rectangle on the canvas.
- bbox
- Rectangle bounding box.
- **options
- Rectangle options.
- activedash=
- activefill=
-
Fill color to use when the mouse pointer is
moved over the item, if different from fill. - activeoutline=
- activeoutlinestipple=
- activestipple=
- activewidth=
- Default is 0.0.
- dash=
-
Outline dash pattern, given as a list of segment
lengths. Only the odd segments are drawn. - dashoffset=
- Default is 0.
- disableddash=
- disabledfill=
-
Fill color to use when the item is disabled,
if different from fill. - disabledoutline=
- disabledoutlinestipple=
- disabledstipple=
- disabledwidth=
- Default is 0.
- fill=
- Fill color. An empty string means transparent.
- offset=
- Default is “0,0”.
- outline=
- Outline color. Default is “black”.
- outlineoffset=
- Default is “0,0”.
- outlinestipple=
- Outline stipple pattern.
- state=
- Item state. One of NORMAL, DISABLED, or HIDDEN.
- stipple=
- Stipple pattern.
- tags=
-
A tag to attach to this item, or a tuple
containing multiple tags. - width=
- Default is 1.0.
- Returns:
- The item id.
- create_text(position, **options) [#]
-
Draws text on the canvas.
- position
-
Text position, given as two coordinates. By
default, the text is centered on this position. You can
override this with the anchor option. For example, if
the coordinate is the upper left corner, set the
anchor to NW. - **options
- Text options.
- activefill=
-
Text color to use when the mouse pointer is
moved over the item, if different from fill. - activestipple=
- anchor=
-
Where to place the text relative to the given
position. Default is CENTER. - disabledfill=
-
Text color to use when the item is disabled,
if different from fill. - disabledstipple=
- fill=
- Text color. Default is “black”.
- font=
- Font specifier. Default is system specific.
- justify=
- Default is LEFT.
- offset=
- Default is “0,0”.
- state=
- Item state. One of NORMAL, DISABLED, or HIDDEN.
- stipple=
- Stipple pattern.
- tags=
-
A tag to attach to this item, or a tuple
containing multiple tags. - text=
- The text to display.
- width=
-
Maximum line length. Lines longer than this value
are wrapped. Default is 0 (no wrapping). - Returns:
- The item id.
- create_window(position, **options) [#]
-
Places a Tkinter widget on the canvas. Note that widgets are
drawn on top of the canvas (that is, the canvas acts like a
geometry manager). You cannot draw other canvas items on top
of a widget.- position
- Window position, given as two coordinates.
- **options
- Window options.
- anchor=
-
Where to place the widget relative to the given
position. Default is CENTER. - height=
-
Window height. Default is to use the window’s
requested height. - state=
- Item state. One of NORMAL, DISABLED, or HIDDEN.
- tags=
-
A tag to attach to this item, or a tuple
containing multiple tags. - width=
-
Window width. Default is to use the window’s
requested width. - window=
- Window object.
- Returns:
- The item id.
- dchars(item, from, to=None) [#]
-
Deletes text from an editable item.
- item
- Item specifier.
- from
- Where to start deleting text.
- to
-
Where to stop deleting text. If omitted, a single
character is removed.
- delete(item) [#]
-
Deletes all matching items. It is not an error to give an
item specifier that doesn’t match any items.- item
- Item specifier (tag or id).
- dtag(item, tag=None) [#]
-
Removes the given tag from all matching items. If the tag is
omitted, all tags are removed from the matching items. It is
not an error to give a specifier that doesn’t match any items.- item
- The item specifier (tag or id).
- tag
-
The tag to remove from matching items. If omitted,
all tags are removed.
- find_above(item) [#]
-
Returns the item just above the given item.
- item
- Reference item.
- find_all() [#]
-
Returns all items on the canvas. This method returns a tuple
containing the identities of all items on the canvas, with the
topmost item last (that is, if you haven’t change the order
using lift or lower, the items are
returned in the order you created them). This is shortcut for
find_withtag(ALL).- Returns:
- A tuple containing all items on the canvas.
- find_below(item) [#]
-
Returns the item just below the given item.
- item
- Reference item.
- find_closest(x, y, halo=None, start=None) [#]
-
Returns the item closest to the given position. Note that the
position is given in canvas coordinates, and that this method
always succeeds if there’s at least one item in the canvas. To
find items within a certain distance from a position, use
find_overlapping with a small rectangle centered
on the position.- x
- Horizontal screen coordinate.
- y
- Vertical screen coordinate.
- halo
- Optional halo distance.
- start
- Optional start item.
- Returns:
- An item specifier.
- find_enclosed(x1, y1, x2, y2) [#]
-
Finds all items completely enclosed by the rectangle
(x1, y1, x2, y2).- x1
- Left edge.
- y1
- Upper edge.
- x2
- Right edge.
- y2
- Lower edge.
- Returns:
- A tuple containing all matching items.
- find_overlapping(x1, y1, x2, y2) [#]
-
Finds all items that overlap the given rectangle, or that are
completely enclosed by it.- x1
- Left edge.
- y1
- Upper edge.
- x2
- Right edge.
- y2
- Lower edge.
- Returns:
- A tuple containing all matching items.
- find_withtag(item) [#]
-
Finds all items having the given specifier.
- item
- Item specifier.
- focus(item=None) [#]
-
Moves focus to the given item. If the item has keyboard bindings,
it will receive all further keyboard events, given that the canvas
itself also has focus. It’s usually best to call focus_set on the
canvas whenever you set focus to a canvas item.To remove focus from the item, call this method with an empty
string.To find out what item that currently has focus, call this method
without any arguments.- item
-
Item specifier. To remove focus from any item,
use an empty string. - Returns:
-
If the item specifier is omitted, this method returns
the item that currently has focus, or None if no item has
focus.
- gettags(item) [#]
-
Gets tags associated with an item.
- item
- Item specifier.
- Returns:
- A tuple containing all tags associated with the item.
- icursor(item, index) [#]
-
Moves the insertion cursor to the given position. This method
can only be used with editable items.- item
- Item specifier.
- index
- Cursor index.
- index(item, index) [#]
-
Gets the numerical cursor index corresponding to the given index.
Numerical indexes work like Python’s sequence indexes; 0 is just
to the left of the first character, and len(text) is just to the
right of the last character.- item
- Item specifier.
- index
-
An index. You can use a numerical index, or one of
INSERT (the current insertion cursor), END (the length of the
text), or SEL_FIRST and SEL_LAST (the selection start and end).
You can also use the form “@x,y” where x and y are canvas
coordinates, to get the index closest to the given coordinate. - Returns:
- A numerical index (an integer).
- insert(item, index, text) [#]
-
Inserts text into an editable item.
- item
- Item specifier.
- index
-
Where to insert the text. This can be either a
numerical index or a symbolic constant. See the description
of the index method for details. If you insert
text at the INSERT index, the cursor is moved along with the
text. - text
- The text to insert.
- itemcget(item, option) [#]
-
Gets the current value for an item option.
- item
- Item specifier.
- option
- Item option.
- Returns:
-
The option value. If the item specifier refers to more
than one item, this method returns the option value for the
first item found.
- itemconfig(item, **options) [#]
-
Changes one or more options for all matching items.
- item
- Item specifier.
- **options
- Item options.
- itemconfigure(item, **options) [#]
-
Same as itemconfig.
- lift(item, **options) [#]
-
(Deprecated) Moves item to top of stack. Same as
tag_raise. - lower(item, **options) [#]
-
(Deprecated) Moves item to bottom of stack. Same as
tag_lower. - move(item, dx, dy) [#]
-
Moves matching items by an offset.
- item
- Item specifier.
- dx
- Horizontal offset.
- dy
- Vertical offset.
- postscript(**options) [#]
-
Generates a Postscript rendering of the canvas contents.
Images and embedded widgets are not included.- **options
- Postscript options.
- scale(self, xscale, yscale, xoffset, yoffset) [#]
-
Resizes matching items by scale factor. The coordinates for
each item are recalculated as ((coord-offset)*scale+offset);
in other words, each item first moved by -offset, then multiplied
with the scale factor, and then moved back again. Note that this
method modifies the item coordinates; you may loose precision
if you use this method several times on the same items.- xscale
- Horizontal scale.
- yscale
- Vertical scale.
- xoffset
- Horizontal offset, in canvas coordinates.
- yoffset
- Vertical scale, in canvas coordinates.
- scan_dragto(x, y) [#]
-
Scrolls the widget contents relative to the scanning anchor.
The contents are moved 10 times the distance between the anchor
and the given position. Use scan_mark to set
the anchor.- x
- The horizontal coordinate.
- y
- The vertical coordinate.
- scan_mark(x, y) [#]
-
Sets the scanning anchor. This sets an anchor that can be used
for fast scrolling to the given mouse coordinate.- x
- The horizontal coordinate.
- y
- The vertical coordinate.
- select_adjust(item, index) [#]
-
Adjusts the selection, so that it includes the given index. This
method also sets the selection anchor to this position. This is
typically used by mouse bindings.- item
- Item specifier.
- index
- Selection index.
- select_clear() [#]
-
Removes the selection, if it is in this canvas widget.
- select_from(item, index) [#]
-
Sets the selection anchor point. Use select_adjust
or select_to to extend the selection.- item
- Item specifier.
- index
- Selection anchor.
- select_item() [#]
-
Returns the item that owns the text selection for this canvas
widget.Note that this method always returns None in some older versions
of Tkinter. To work around this problem, replace the method call
with canvas.tk.call(canvas._w, “select”, “item”).- Returns:
- Item specifier, or None if there’s no selection.
- select_to(item, index) [#]
-
Modifies the selection so it includes the region between the
current selection anchor and the given index. The anchor is
set by select_from or select_adjust.- item
- Item specifier.
- index
- Selection end point.
- tag_bind(item, event=None, callback, add=None) [#]
-
Adds an event binding to all matching items.
Note that the new bindings are associated with the items, not
the tag. For example, if you attach bindings to all items having
the movable tag, they will only be attached to any
existing items with that tag. If you create new items tagged as
movable, they will not get those bindings.- item
- The item specifier (tag or id).
- event
- The event specifier.
- callback
-
A callable object that takes one argument.
This callback is called with an event descriptor, for
events matching the given event specifier. - add
-
Usually, the new binding replaces any existing
binding for the same event sequence. If this argument
is present, and set to “+”, the new binding is added to
to any existing binding.
- tag_lower(item) [#]
-
Moves a canvas item to the bottom of the canvas stack. If
multiple items match, they are all moved, with their relative
order preserved.This method doesn’t work with window items. To change their
order, use lower on the widget instance instead.- item
- Item specifier.
- tag_raise(item) [#]
-
Moves the given item to the top of the canvas stack. If multiple
items match, they are all moved, with their relative order
preserved.This method doesn’t work with window items. To change their
order, use lift on the widget instance instead.- item
- Item specifier.
- tag_unbind(self, item, event) [#]
-
Removes the binding, if any, for the given event sequence.
This applies to all matching items.- item
- Item specifier.
- sequence
- Event specifier.
- tkraise(item, **options) [#]
-
(Deprecated) Same as tag_raise.
- type(item) [#]
-
Returns the type of the given item. If item refers to more
than one item, this method returns the type of the first item
found.- item
- Item specifier.
- Returns:
-
A string, giving the item type. This can be one of
“arc”, “bitmap”, “image”, “line”,
“oval”, “polygon”, “rectangle”,
“text”, or “window”.
- xview(how, *args) [#]
-
Adjusts the canvas view horizontally.
- how
-
How to adjust the canvas. This can be either
“moveto” or “scroll”. - *args
-
Additional arguments. For the “moveto” method,
this is a single fraction. For the “scroll” method, this
is a unit and a count. For details, see the descriptions
of the xview_moveto and
xview_scroll methods.
- xview_moveto(fraction) [#]
-
Adjusts the canvas so that the given offset is at the left
edge of the canvas.- fraction
-
Scroll offset. Offset 0.0 is the beginning of
the scrollregion, 1.0 the end.
- xview_scroll(number, what) [#]
-
Scrolls the canvas horizontally by the given amount.
- number
- Number of units.
- what
-
What unit to use. This can be either “units”
(small steps) or “pages”.
- yview(how, *args) [#]
-
Adjusts the canvas view vertically.
- how
-
How to adjust the canvas. This can be either
“moveto” or “scroll”. - *args
-
Additional arguments. For the “moveto” method,
this is a single fraction. For the “scroll” method, this
is a unit and a count. For details, see the descriptions
of the yview_moveto and
yview_scroll methods.
- yview_moveto(fraction) [#]
-
Adjusts the canvas so that the given offset is at the top
edge of the canvas.- fraction
-
Scroll offset. Offset 0.0 is the beginning of
the scrollregion, 1.0 the end.
- yview_scroll(number, what) [#]
-
Scrolls the canvas vertically by the given amount.
- number
- Number of units.
- what
-
What unit to use. This can be either “units”
(small steps) or “pages”.